
A practical starting point is to allocate roughly 7% to 8% of gross revenue to marketing when your margins support it. That's a planning benchmark, not a universal rule, and your actual small business marketing costs should reflect your growth goals, capacity, appointment value, sales cycle, and cash flow.
You may be facing this decision between patient appointments, client work, and payroll. One agency is quoting a monthly retainer, Google Ads promises immediate visibility, and someone has told you to spend a fixed percentage of revenue. The problem is that these figures often describe different things. Advertising is only one part of marketing, and an ad budget can't compensate for a confusing website, missed calls, weak reviews, or a booking calendar with no available appointments.
Table of Contents
- Understanding Small Business Marketing Costs
- What the Averages Really Mean
- How Pricing Models Change Your Monthly Costs
- Sample Marketing Budgets by Practice Type
- Measuring ROI and Cost Per Acquisition
- When Percentage-of-Revenue Budgets Fail
- Real Budget Lessons from Local Practices
Understanding Small Business Marketing Costs
You sit down to set a budget, and three different numbers show up. One quote covers agency work. One covers ad spend. One uses a percentage of revenue. The first job is separating those buckets so you do not fund clicks while ignoring the website, intake process, and follow-up that turn those clicks into booked appointments.
For businesses with annual revenue below $5 million, the U.S. Small Business Administration benchmark often cited is roughly 7% to 8% of gross revenue for marketing when margins can support it, as summarized in this SBA marketing benchmark overview. On $300,000 a year, that works out to about $21,000 to $24,000. On $500,000, it becomes $35,000 to $40,000. Use those numbers as planning guardrails, not a default monthly charge you accept without asking what the business can actually handle.
A useful budget starts by splitting working media from operating overhead.
- Strategy and positioning: deciding which services to push, who the right customer is, and what makes the practice credible.
- Conversion assets: website updates, landing pages, forms, online scheduling, call tracking, and clearer calls to action.
- Visibility: search optimization, paid search, social campaigns, local listings, community events, and content.
- Trust and retention: reviews, referral programs, email communication, patient education, and client follow-up.
- Operating support: software, reporting, creative production, internal labor, and outside specialists.

Advertising is not the whole budget
The same benchmark discussion often points to advertising as only a small slice of total revenue, around 1.08% overall, with wide variation by industry. On $500,000 in revenue, that example would be $5,400 in ads. The rest of a broader $35,000 to $40,000 marketing budget pays for the work that makes advertising perform in the first place.
That matters in practices where one missed call, one weak service page, or one full schedule can waste paid traffic. A dentist, optometrist, medspa owner, or law firm partner does not need more leads than the team can answer. They need the right lead volume, a credible online presence, available capacity, and a process that turns inquiries into visits or consultations.
Set the total ceiling first. Then assign fixed operating costs, and only after that decide how much can go into variable media spend.
For channel ideas beyond paid media, insights from Business Loan Warrior can help you compare local, digital, and community-based promotion. The smart move is building a channel mix that matches appointment value, sales cycle, and capacity, instead of trying to spend everywhere at once.
What the Averages Really Mean
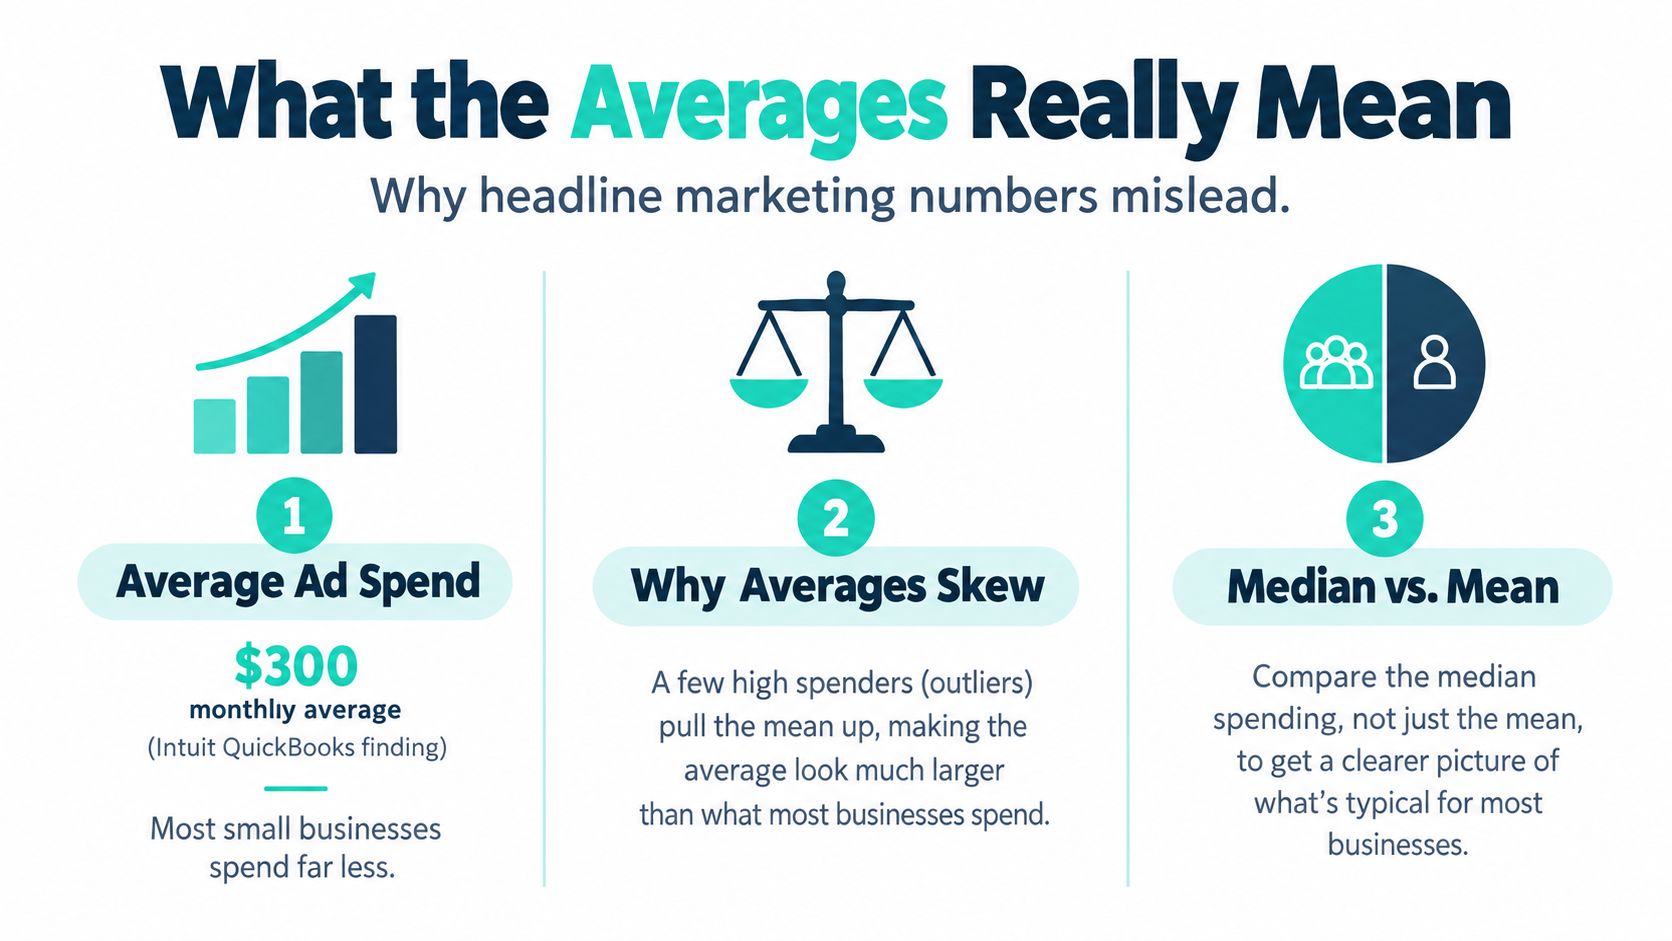
Averages can give owners useful context, but they can also create unrealistic expectations. Intuit's 2025 Small Business Advertising Trends Report estimated average small-business advertising expenditure at approximately $78,000 annually, or about $6,500 per month, with advertising representing 37% of respondents' total marketing budgets. Applying that ratio implies an average total marketing budget of roughly $211,000, as detailed in the Intuit 2025 advertising report.
That doesn't mean a neighborhood dental practice should suddenly budget $78,000 for ads. The survey includes businesses with different industries, employee counts, growth plans, and revenue levels. Larger or faster-growing companies can pull the average upward, making the result a directional reference rather than a recommended spend for every small firm.
Industry changes the economics
Intuit's report identified industry groups with average advertising budgets of approximately $127,000, $139,000, and $148,000, illustrating how customer value, competition, and business scale affect spending. A legal matter, elective procedure, or recurring care relationship may justify a different acquisition cost than a low-ticket purchase, but the higher value doesn't automatically make every campaign profitable.
Traditional advertising also remains material. One historical benchmark reported that 46.6% of small-business marketing budgets went to traditional advertising, which reinforces the point that “marketing cost” doesn't mean only Google Ads, Meta, or TikTok.
The better question is, “What must this budget accomplish?” A local practice may need a combination of paid search, social campaigns, reputation management, website improvements, referral activity, content, and community visibility. A law firm with a longer sales cycle may need stronger consultation follow-up, while a medspa may prioritize visual creative and repeat visits.
Read the benchmark before using it
Before comparing your budget with an average, identify three things:
- What the figure measures: Advertising, total marketing, or marketing plus internal labor?
- Who was surveyed: Solo operators, established businesses, or larger growth-oriented companies?
- What outcome matters: Clicks, qualified inquiries, booked appointments, acquired patients, or signed matters?
A headline average is useful only after those questions have answers. Otherwise, it can encourage you to overspend on visibility while underfunding the systems that convert attention into revenue.
How Pricing Models Change Your Monthly Costs
The same marketing work can produce very different cash-flow patterns depending on how you buy it. An in-house employee creates a continuing employment commitment and builds institutional knowledge. An agency retainer creates predictable external spending and may combine planning, content, reporting, and campaign management. Project-based work offers flexibility, but you may pay repeatedly to restart context and coordination.
In-house hiring
An employee can understand your services, staff, patients, and internal priorities more thoroughly than an outside specialist. That continuity helps when the role includes content, community relationships, patient communication, and day-to-day coordination.
The trade-off is that salary isn't the full cost. Benefits, management time, training, tools, creative production, and coverage during leave all affect the overall expense. An employee who spends part of the week on marketing may also lack specialist expertise in paid search, analytics, conversion copy, or local search.
Retainers and projects
A monthly retainer usually works best when your practice needs consistent execution. You pay for an ongoing operating rhythm, such as campaign optimization, reporting, content, listings, and landing-page improvements. The risk is scope ambiguity. A low headline fee can become expensive if every strategy call, revision, or new asset costs extra.
Project-based work suits a defined need, such as a website rebuild, brand refresh, tracking setup, or a specific landing page. It doesn't automatically provide the ongoing testing that local acquisition requires. A beautiful site can still underperform if nobody reviews search terms, missed calls, booking rates, and lead quality afterward.
| Pricing structure | Strength | Cost risk |
|---|---|---|
| In-house | Deep internal knowledge and control | Employment overhead and unused capacity |
| Retainer | Predictable continuity and specialist access | Paying for unclear or underused scope |
| Project | Clear deliverable and flexible commitment | Gaps between projects and repeated onboarding |
| Hybrid | Internal ownership with external expertise | Coordination and duplicated tools |
Don't overlook operational costs. A receptionist, answering service, CRM, reporting platform, listings software, photography, video, and design can all influence acquisition efficiency. For a useful comparison of answering-service economics, review this SkipCalls cost breakdown, then include response handling in your marketing model rather than treating it as unrelated overhead.
When you evaluate an external partner, compare deliverables, ownership, reporting, cancellation terms, and media handling. Leaping Lemur Media's services represent one example of a service structure that can combine strategic and execution support, but the right model depends on your internal capacity and risk tolerance.
Sample Marketing Budgets by Practice Type
A useful budget isn't a single number. It's a monthly allocation that matches what your team can absorb and what each service is worth. Start by choosing a ceiling, then reserve enough for measurement and conversion infrastructure before putting the remainder into paid acquisition.
Lean startup practice
A new dental, vision, legal, or medspa business might begin with a deliberately narrow program:
- Website and conversion setup: Build or improve core service pages, forms, scheduling, analytics, and call tracking.
- Local visibility: Establish listings, review requests, and a consistent profile across important directories.
- Content and creative: Produce a small set of service explanations, staff introductions, and useful educational assets.
- Paid testing: Choose one high-intent channel rather than spreading money across every platform.
- Follow-up: Create a process for returning calls, responding to inquiries, and recording outcomes.
The priority is learning. Don't buy broad awareness before you know which services generate qualified demand and whether your team can handle it.
Established local business
A steady-state practice can divide spending between maintenance and acquisition. Keep the website, listings, reviews, and reporting reliable, then direct paid media toward services with available capacity and acceptable contribution margin. A dental practice with full hygiene appointments may shift attention toward higher-value restorative work. An optometry office may promote an underused service line rather than increase total reach.
Dental marketing services can provide useful context when adapting a budget to patient acquisition, local search, reputation, and appointment conversion.
Growth-oriented firm
A practice preparing to expand needs more than additional ad spend. It may require location pages, stronger creative, staff training, CRM workflows, reputation management, and a documented response process. Allocate by funnel stage:
- Demand capture: Search and other channels that reach people already looking.
- Trust building: Reviews, content, community presence, and proof of expertise.
- Conversion: Landing pages, calls, scheduling, intake, and follow-up.
- Retention: Recall, reactivation, referrals, and ongoing patient or client communication.
Base each allocation on appointment value, sales cycle length, local competition, and available capacity. If the schedule is full, spend can shift toward retention or higher-margin services rather than creating more inquiries.
Measuring ROI and Cost Per Acquisition
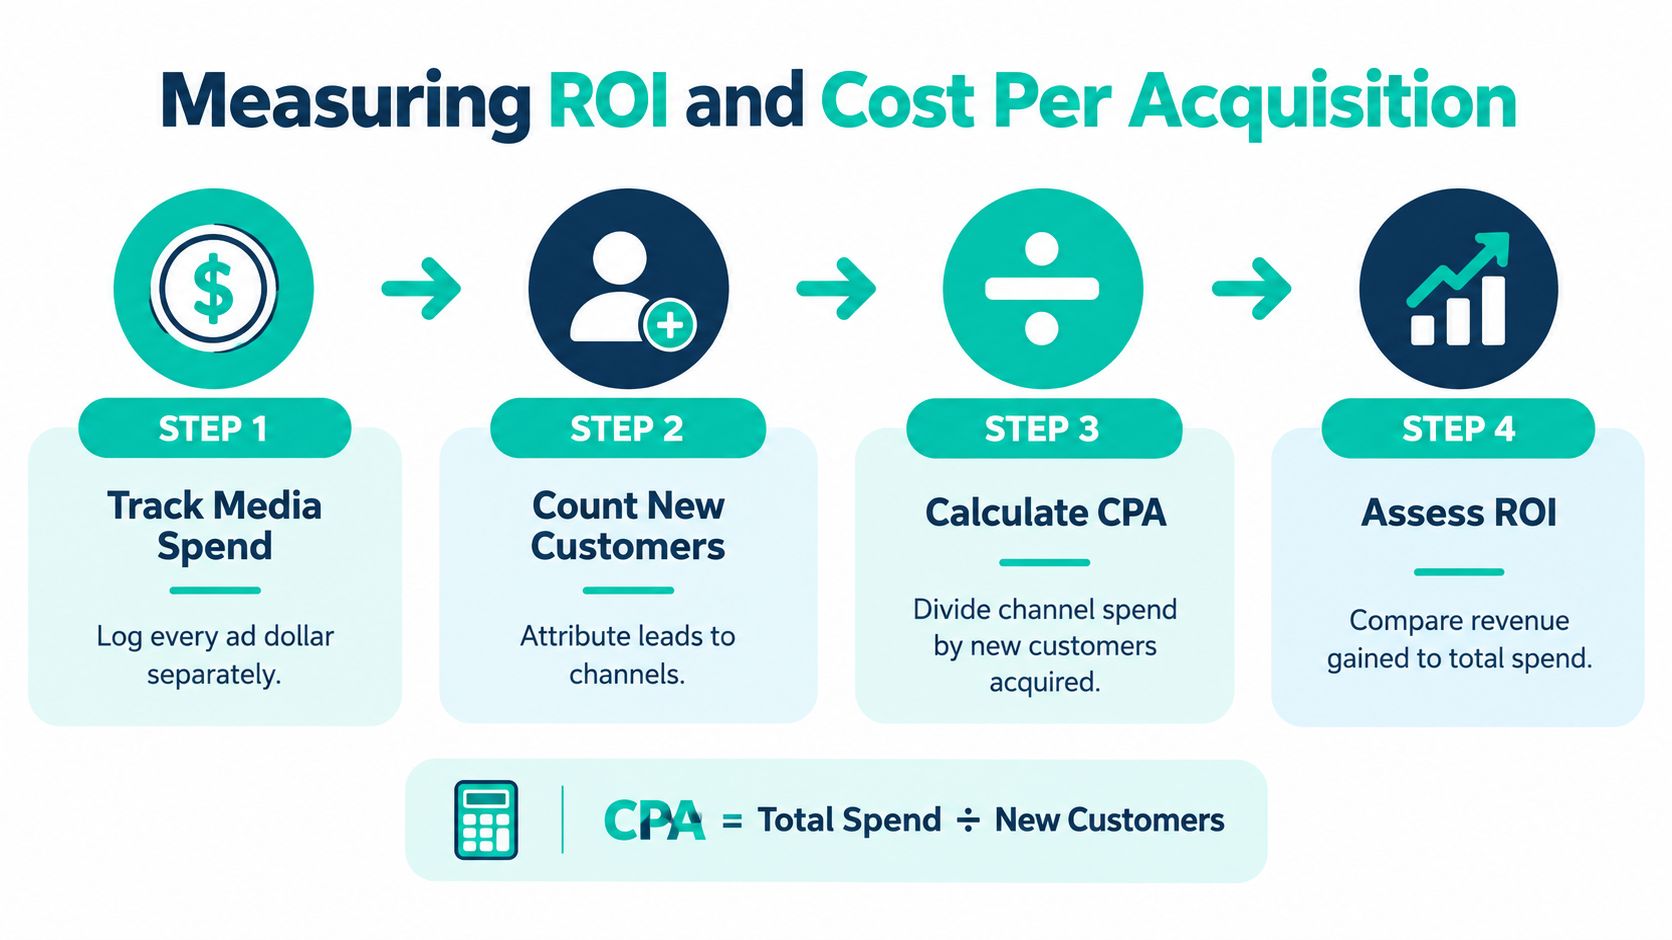
Marketing becomes manageable when you connect spending to business outcomes. Start by recording the full cost of the program, not only the amount charged by Google or Meta.
A practical model is:
Total marketing cost = media spend + creative and production + technology + internal labor + external services
Then measure the journey from inquiry to revenue. A click is an interaction. A qualified lead is closer to value, but even a qualified lead isn't an acquired patient, client, or signed matter.
Track the numbers that change decisions
Use a simple spreadsheet or CRM with fields for source, service requested, inquiry date, response status, appointment or consultation, outcome, and revenue. Connect call tracking and form submissions to the channel that generated them, then audit a sample of records manually. Automation helps, but staff still need to classify poor-fit inquiries and duplicate contacts.
For paid search, channel costs can vary sharply. A 2025 benchmark covering more than 16,000 Google Ads campaigns reported an average cost per click of $5.26 across industries, with averages of $2.05 for restaurants and food, $5.00 for health and fitness, $5.58 for business services, $7.85 for home and home improvement, and $8.58 for attorneys and legal services. The same benchmark reported average costs per lead of $62.80 for health and fitness, $103.54 for business services, and $131.63 for legal services, as shown in this Google Ads industry benchmark.
At the overall $5.26 CPC, a $1,500 monthly ad budget would generate roughly 285 clicks before variation, invalid traffic, and optimization. That calculation doesn't tell you how many people will book, attend, or become profitable clients. It only shows why clicks are an incomplete scorecard.
Use contribution margin, not vanity metrics
Calculate cost per qualified lead and cost per acquired patient or client. Then compare incremental gross profit generated with incremental marketing cost. A campaign can look efficient on cost per lead while producing low-value inquiries, and a more expensive channel can be worthwhile if it attracts cases or procedures with stronger contribution margins.
Watch for operational constraints. If your team can't answer calls, has no appointment availability, or loses inquiries during intake, more media won't fix the bottleneck. A financially grounded guide to fractional CFO ROI offers useful context for connecting investment decisions to broader financial accountability.
When Percentage-of-Revenue Budgets Fail
A revenue percentage is convenient because it gives owners a starting point. It becomes dangerous when it replaces judgment. New businesses may have little or no reliable revenue history, seasonal practices can experience uneven cash flow, and low-margin providers may not be able to fund a percentage that looks reasonable on paper.
Recent local-business data shows why averages need interpretation. One 2025 local-business survey found that 39% of businesses spend less than $1,000 on marketing, while another survey reported that roughly four in ten allocate 6% to 10% of revenue and about one-third spend more than 10%, as summarized in this State of Local 2025 report. Those results aren't necessarily contradictory because the surveys use different samples, definitions, and revenue profiles.
Start with capacity and cash flow
A safer framework separates what you must maintain from what you can scale:
- Fixed operating costs: Website, listings, software, creative foundations, reporting, and measurement.
- Variable acquisition costs: Paid search, paid social, sponsorships, and other campaigns that can rise or fall.
- Conversion capacity: Available appointments, consultation slots, call coverage, intake speed, and follow-up.
- Financial tolerance: Cash reserves, contribution margin, payment timing, and time to conversion.
If your practice can't reliably attribute calls, consultations, booked appointments, or signed matters to channels, a smaller measurable budget can be more rational than a larger percentage commitment. Measurement is not an administrative luxury. It determines whether you can safely increase spend.
Reverse-engineer a safe test
Begin with the service you want to grow. Estimate its contribution margin, not just its headline price. Identify how many additional appointments or matters your team can handle, then set a test budget that won't create cash-flow stress before those outcomes arrive.
Review the test using three questions:
- Are qualified inquiries reaching the right service?
- Does the team convert those inquiries efficiently?
- Does the resulting contribution margin justify the full marketing cost?
The CMO Survey's broader benchmark places average marketing spending at 9.4% of company revenue, while Gartner's 2025 CMO Spend Survey reports an average of 7.7%. Gartner's figure came from a survey of 402 marketing leaders, was weighted toward larger organizations, remained unchanged from 2024, and was lower than 9.5% reported three years earlier, according to this marketing budget benchmark comparison. Those figures provide context, not a target for a local practice.
Real Budget Lessons from Local Practices
A dental clinic may start by promoting new-patient appointments, then discover that its real constraint is unanswered calls and limited chair availability. The sensible adjustment isn't automatically more advertising. It may be better call handling, clearer service pages, review generation, and a campaign focused on appointments the clinic can accommodate.
An eye-care practice can face a different problem. Search visibility may be adequate, but prospects don't understand the difference between routine exams, specialty care, and eyewear services. Clearer copy and more useful landing pages can improve the value of existing traffic before the practice expands its media spend. A focused optometry marketing approach should account for that service mix.
A medspa often needs strong visual creative, consistent follow-up, and retention activity alongside acquisition. A law firm may need patience because consultations can take longer to become signed matters. In both cases, tracking only inquiries can make a channel look successful before the practice knows whether those inquiries become profitable engagements.
The common lesson is simple: budget for the whole path from visibility to revenue. Protect measurement, conversion assets, response handling, and retention before increasing media. Then scale the channels that produce qualified outcomes within your capacity and reduce the ones that generate activity without profitable results.
Leaping Lemur Media helps practices connect positioning, local search, reputation, landing pages, and paid growth across Google, Meta, and TikTok while evaluating campaigns against profit. Visit Leaping Lemur Media to discuss a marketing budget built around your actual capacity, service value, and growth goals.